
State of Investing Today During Commercial Real Estate Downturn

KEY POINTS
Global stocks continued rallying in the first quarter, amid persistent earnings growth and expectations around artificial intelligence. Meanwhile, global bond market returns were muted as interest rates generally increased. Looking ahead, we discuss why stock market gains could continue, and why bond markets could still be set for a positive year.
The U.S. economy had a solid start to the year and continued to grow in the first quarter, however inflation was higher than expected. Looking ahead, we discuss why economic prospects will remain positive and why inflation should resume a gradual decline.
The commercial real estate market has undergone a significant downturn and sentiment towards it is extremely negative. We discuss the current state of the real estate asset class and what may lie ahead for it.
Informed by current market and economic conditions coupled with a long-term investment view, we discuss our recommendations around portfolio positioning and management.
VIEW A SHORT SUMMARY VIDEO

MARKET REVIEW
POSITIVE MOMENTUM IN STOCK MARKETS CONTINUED IN THE FIRST QUARTER
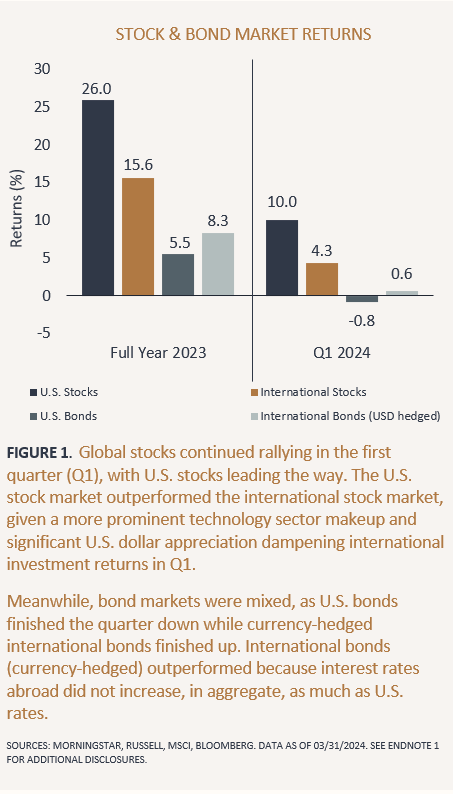
Global stock markets gained materially in the first quarter, continuing the rally from last year. (See Figure 1.) Resilient profit growth and enthusiasm about artificial intelligence (AI) helped drive stocks higher, especially companies seen as the most likely to benefit initially from AI-driven demand and productivity increases. Stock prices pushed higher, and market volatility remained subdued in the first quarter despite uncertainty around “higher-for-longer” interest rate policy, geopolitical conflicts abroad, and upcoming U.S. elections.
BOND MARKETS PAUSED AMID A SLIGHT REVERSAL IN THE DIRECTION OF LONG-TERM INTEREST RATES
Global bond markets took a breather in the first quarter after strong returns in the fourth quarter of last year. Longer-term interest rates generally increased, reversing course, across global developed markets in the quarter, particularly in the U.S., which negatively impacted bond market performance. The rise in interest rates reflected reduced expectations for rate cuts later this year, given still resilient economic activity and persistent inflation. In April, the Fed confirmed that it needs "greater confidence" that inflation is moving sustainably down toward 2% before they start cutting interest rates.
MARKET OUTLOOK
STOCK MARKET GAINS COULD CONTINUE; HOWEVER, VOLATILITY MAY RISE
Stock market gains could continue amid the current supportive macro backdrop. Strong economic activity and favorable monetary (interest rate) and fiscal (spending) policy on the horizon should bode well for stocks. Furthermore, despite elevated valuations, stock market gains could continue if earnings keep coming in better than expected and if more companies and sectors (beyond the mega-cap tech stocks) start performing better. Broader stock market participation across less expensive value stocks and most mid- and small-capitalization stocks would likely occur if economic growth remains positive, disinflation resumes, and interest rates eventually come down.
However, as we head further into 2024, negative catalysts could emerge that impact investor sentiment and expectations, resulting in stock market declines. Downside market volatility is likely to rise if economic growth slows significantly more than expected due to the lagged effects of the Fed’s tightening or if inflation flares up materially again, resulting in another Fed pivot back to a more restrictive stance. Additionally, global geopolitical risk and uncertainty about the U.S. Presidential election remain elevated.
DESPITE THEIR INITIAL SETBACK, BONDS ARE STILL LIKELY TO DELIVER POSITIVE RETURNS THIS YEAR
Bond returns are likely to be positive this year, given their current yields and the outlook for interest rate policy. High-quality investment-grade bonds now yield 4.85%-to-5.90% after the move-up in longer-term interest rates in the first quarter.² Moreover, despite recent inflation data coming higher than expected, a resumption of central bank rate policy hikes still appears off the table. In the U.S., the higher probability scenarios for the next Fed move(s) will either be to lower its policy rate or keep it where it is for longer.
In either interest rate policy move scenario, bond investors are looking at a favorable return environment. If central banks start to lower rates or even indicate plans to do so sooner (or more aggressively) than anticipated, prices for intermediate and long-term bonds will appreciate, boosting their returns. On the other hand, if central banks keep policy rates at current levels for longer, investors will continue to benefit from the current attractive bond interest yields.
ECONOMIC REVEW
THE U.S. ECONOMY CONTINUED GROWING AND INFLATION PRESSURES RETURNED
The U.S. economy had a solid start to the year despite the Fed's efforts to cool it to rein in inflation by keeping interest rates elevated. The U.S. economy continued growing in the first quarter, expanding at an initially estimated 1.6% annual rate.³ Although this growth rate was less than expected and slower than last year's quick pace, the overall picture continues to be one of solid growth due to a strong job market and consumer spending. Better-than-expected workforce and productivity gains are behind the labor market's continued strength. Job growth and wage increases continued to fuel household consumption.
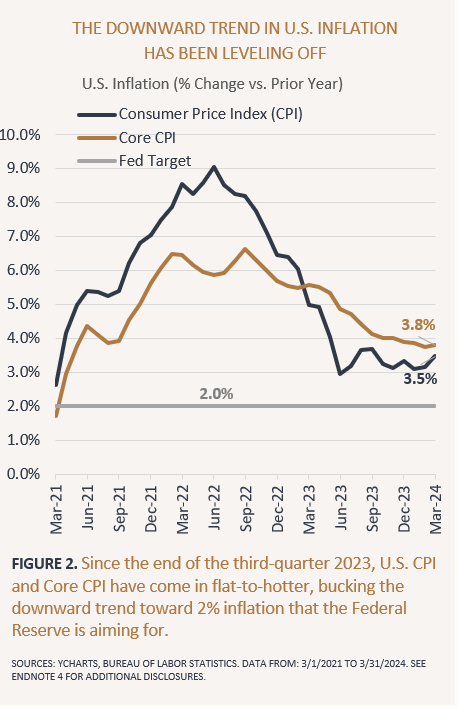
Inflation in the U.S. was higher than expected in the first quarter as the downward trend leveled off. (See Figure 2.) Turn-of-the-year seasonality in shelter costs helped explain firmer price increases in January and February. However, in March, service prices outside of housing, including everything from car insurance to medical care, resulted in three consecutive months of stronger-than-anticipated inflation readings, derailing hopes that the Fed might cut rates as soon as this summer.
MAJOR INTERNATIONAL ECONOMIES HAVE HELD UP BETTER THAN EXPECTED
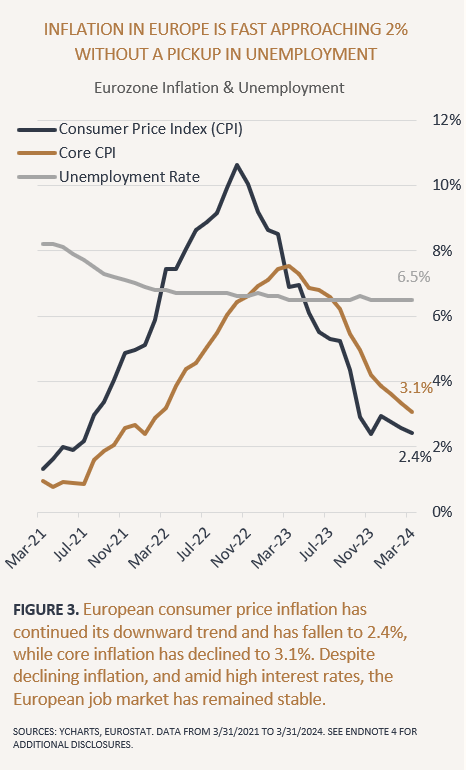
Major European economies have broadly stagnated due to prior years' central bank interest rate hikes. Weakness in global trade, partly due to lower Chinese demand, has particularly impacted export-oriented European country manufacturing sectors. On the positive side, continental Europe has thus far avoided a deep recession that many economists anticipated, with signs that businesses and consumers have adjusted to higher rates quicker than expected. Moreover, inflation across Europe has continued to decline and is fast approaching central banks' 2% targets while jobs markets remain stable. (See Figure 3.)
In Asia, China is still experiencing persistent economic challenges stemming from an extended property downturn, which has negatively impacted consumer spending. On the other hand, China's economy is getting a boost from the government's push to turbo-charge manufacturing and exports by investing heavily in new factories. Recent better-than-expected industrial production data suggest the strategy is working. More broadly, China's economy grew by a better-than-expected 5.3% in the first quarter.⁵
Meanwhile, in Japan, its central bank finally ended its negative interest rate policy at its March meeting. After eight years, this policy normalization was a historic move that signaled that decades of deflation in Japan had officially ended. Recent stronger-than-expected wage increases indicate that the Japanese economy has started to see internally driven inflation growth.
ECONOMIC OUTLOOK
THE U.S. ECONOMY WILL LIKELY REMAIN HEALTHY FOR SOME TIME, BUT INFLATION SHOULD RESUME A GRADUAL DECLINE
The U.S. economy will likely remain on solid footing as job growth continues for much of 2024. The labor market could eventually start to slow; however, the unemployment rate will likely not increase materially this year, particularly if the number of job openings stays elevated. As such, consumer spending growth should continue, but likely more slowly, as excess savings continue running down, wage increases diminish, and banks maintain tight lending standards.
Despite the economy's continued strength, inflation should resume declining, albeit gradually, as sticky services inflation slowly unwinds. As such, achieving the Fed's goal of bringing inflation back down to the 2% level will likely take longer than expected. Given still elevated inflation and the continued strength of the U.S. economy, we maintain our view that rate cuts (never mind aggressive rate cuts) are not imminent.
ECONOMIES ABROAD ARE LIKELY TO REMAIN CHALLENGED IN THE NEAR TERM BUT GROWTH PROSPECTS SHOULD GRADUALLY IMPROVE
Europe's economic growth prospects will likely remain challenged in the near term; however, the immediate-term outlook may be brighter than expected.
Economic data that gauge future activity are either in expansion territory or inflecting upwards in most major European economies. (See Figure 4.) Meanwhile, inflation is in sight of the European Central Bank's (ECB) 2% target. Against the challenging but slightly improving backdrop, the ECB's first interest rate cuts could come as soon as June (ahead of U.S. Fed rate cuts). This shift towards rate cuts (easing) after two years of rate hikes (tightening) should help improve Europe's economic outlook.

China's economy is likely to experience an uneven recovery. Given the government's policy priorities for investment and manufacturing upgrades, industrial and export activity should continue improving. However, if the housing downturn persists, consumers could further curtail spending, leading to a potentially deflationary environment. Therefore, more policy support is likely on the way to help boost consumer spending and interest rates and bank reserve requirement ratios will likely be cut to mitigate deflationary pressures.
Meanwhile, if Japan's economy continues to show signs of exiting its long-term deflationary spiral, its central bank will likely continue raising its interest rates (from extremely low levels). The longer Japan stays out of a deflationary environment, the more positive economic growth it will likely get, boosted by increased corporate and household consumption and investment.
ON THE MINDS OF INVESTORS
COMMERCIAL REAL ESTATE DOWNTURN - WHAT MAY LIE AHEAD FOR INVESTORS
The rapid rise in interest rates during the roughly eighteen-month period starting in early 2022 resulted in material downward repricing of public stock and bond markets as well as public and private commercial real estate (CRE) markets. Even before the rate increases, many key sectors within CRE were challenged by pandemic-related issues. Now, amid higher rates, CRE faces challenges with looming debt refinancing as a significant amount of CRE-based debt comes due.
Why Invest In Commercial Real Estate?
The CRE asset class is the third largest investable asset class in the U.S., next to equities and bonds.⁷ The CRE asset class has historically not been perfectly correlated to either stocks or bonds and, therefore, has provided diversification to an investment portfolio. Like stocks, CRE investments typically offer income and capital appreciation potential. Although stocks have historically delivered a higher level of growth, CRE investments tend to yield a higher level of income; moreover, they can be tax efficient.⁸ Lastly, CRE investments have the potential to act more effectively as an inflation hedge, as both the value of real estate and rent from CRE investments tend to increase in line with average inflation levels over time.
Pandemic Impact on Commercial Real Estate (Then and Now)
Amid the pandemic, the three CRE sectors that were most negatively impacted were office, retail, and hotel. However, since the end of the pandemic, retail and hotel sectors have recovered significantly and are in relatively good health. Although many retail properties closed for good, properties that survived are now experiencing positive rent growth again. This is because people still shop in person (only 17% of total retail shopping is online⁹), and higher-end retail properties have evolved to incorporate more experience-based and grocery-anchored retail. Meanwhile, the hotel sector has bounced back and is growing as air travel has recovered completely since the pandemic.¹⁰
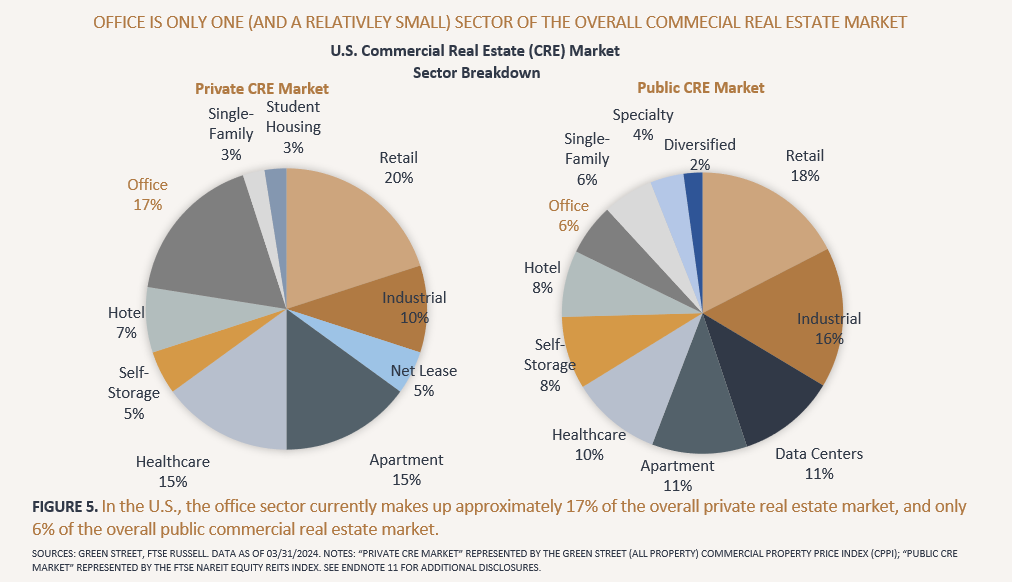
The office sector is the only CRE sector still hurting from the pandemic due to the hybrid work environment. However, not all office properties are under severe pressure; the hybrid work issue has particularly impacted older, non-class-A office buildings in undesirable locations. Nonetheless, the office sector is a relatively small portion of the overall CRE market today. (See Figure 5.) Any further markdowns in the office sector will likely have much less impact on the overall performance of the entire real estate asset class. Additionally, the majority of what is left of the office sector is increasingly newer, updated class-A properties.
Conversely, other real estate sectors (notably industrial and residential) continue to experience strong operating fundamentals, including high occupancy rates and above-average rent growth. This is expected to continue as there is a significant shortage of housing supply, and additional storage and distribution facilities are needed to support the growth of e-commerce. Additionally, newer real estate sectors, including cell towers, data centers, and life science medical centers, should see continued growth as infrastructure is needed to support the growth in technology and healthcare industries.
The Potential Impact of CRE Debt Coming Due
Over $2T of CRE-based debt is coming due in the next three years, which will need to be refinanced, and traditional lenders (mostly regional banks) may not be willing to help replace all the expiring debt.15 This potential capital gap raises concerns that CRE values broadly could experience significantly more downward pressure. However, there are some key reasons why this will likely not be the case or will not be as bad as expected.
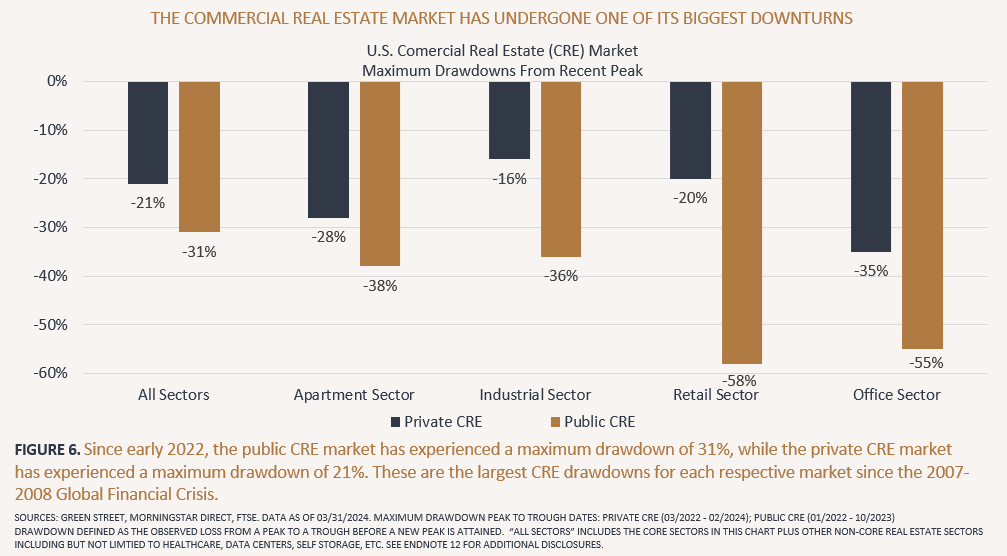
First, the CRE market has already seen a significant valuation drawdown since the early 2022 peak. The rapid increases in short-term policy interest rates significantly increased longer-term real estate borrowing costs, and as a result, commercial real estate property values have gone through one of the worst declines in history. (See Figure 6.) As such, because the U.S. Federal Reserve no longer plans to hike policy rates further, it’s likely that most of the CRE valuation markdowns are behind us.
Secondly, the risk that the pullback in CRE loan availability (supply) will potentially push up CRE debt rates higher and property values lower will likely not be as significant as expected.
Traditional banks broadly are not completely stepping away from CRE lending; rather, they have tightened their lending standards and have dropped available leverage ratios for new loans from ~65% loan-to-value to ~55% loan-to-value.¹³ Furthermore, most, if not all, of the pullback in traditional bank CRE lending will likely be replaced by non-bank lenders, including large private debt asset managers and other private and public debt providers. A similar type of changeover has been happening since the 2008 Global Financial Crisis, with non-bank lenders gradually taking on most of the lending to private companies outside of the real estate sector.
Lastly, there will be plenty of time for the lending transition because CRE debt maturities will occur gradually over a multi-year period, with less than 20% of outstanding CRE loans set to mature within the next two years.¹⁴ Additionally, a significant portion of the debt that is actually expected to default will likely occur in the office sector, specifically for low-quality, obsolete office buildings in undesirable locations, for which values have already declined the most. The amount of outstanding debt maturing in the office space only makes up about 15% of the total debt maturing¹⁵, so any defaults within the office space will likely have less impact on the broader CRE property market.
Commercial Real Estate Outlook and Asset Allocation
The last couple of years have certainly been challenging for the CRE market, particularly the office sector. However, the return outlook for the CRE asset class is brightening. Most importantly, the Federal Reserve (and other major Central Banks worldwide) have indicated that they plan to stop raising short-term policy rates and, if anything, will likely cut rates at some point as inflation continues to cool. The interest rate peaking should help stabilize CRE values.
Furthermore, despite declining values, most CRE sectors (outside of low-quality office properties) have been able to increase rents in response to higher inflation over the last couple of years. This rental growth, resulting in higher net operating income, will help offset some of the price declines that have occurred and will be additive to future CRE returns. Moreover, the office sector will continue evolving as more of it becomes highly amenitized, class-A buildings in desirable locations, and the properties left behind will be repurposed or rebuilt as different types of commercial real estate.
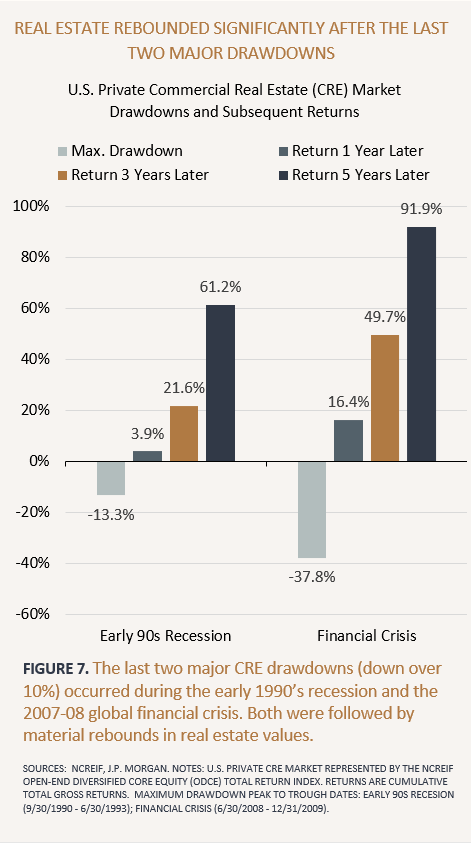
Lastly and perhaps most importantly, the public CRE market, equity real estate investment trusts, are currently trading at a significant discount (~15%) to underlying property net asset values.¹⁶ Historically, when the public CRE market trades at sizable discounts, the market has produced higher-than-average returns in the subsequent one, two, and three-year periods.¹⁷ Similarly, the private CRE market has delivered attractive returns over the years immediately following significant drawdowns. (See Figure 7.)
We continue to recommend that investors maintain a long-term strategic allocation to real estate despite near-term headwinds. Real estate investments should continue to provide investors with the benefits of capital growth, income, tax efficiency, diversification, and an inflation hedge. Looking ahead, most CRE sectors will likely benefit from lower starting valuations, sustained macroeconomic tailwinds, and favorable prospects for continued rental income growth.
PORTFOLIO MANAGEMENT
Our recommendations around portfolio positioning and management are informed by current market and economic conditions coupled with a long-term investment view.
STRATEGICALLY USE STOCK MARKET RALLIES TO YOUR BENEFIT
Stock market rallies, like the one we experienced over the last two quarters, present opportunities for long-term investors. It may be tempting to let portfolio stock allocations drift higher when stock markets are achieving new all-time highs. However, this may have the unintended consequence of increasing portfolio risk. As such, we recommend that investors stay disciplined and, to the extent they are overweight their strategic asset allocation targets, use rallies to sell some higher-priced assets and add to other asset classes that have not been performing well. Implementing this disciplined approach of selling high amid market rallies may not feel logical, but it can help improve portfolio risk-adjusted returns over the long term.
TAKE ADVANTAGE OF THE CURRENT OPPORTUNITIES IN REAL ESTATE AND INFRASTRUCTURE SECURITIES
Publicly traded real estate, as noted earlier, as well as infrastructure securities, have significantly underperformed the broader stock markets, given the significant rise in interest rates over the past two years. The prices of real estate and infrastructure securities are particularly sensitive and have an inverse relationship to interest rates. As such, real estate and infrastructure security prices have declined over the last two years and are currently trading at significant valuation discounts. This recent poor performance has created attractive opportunities for new and additional investment into these asset classes.
SEIZE THE BETTER YIELDS NOW AVAILABLE FROM HIGH-QUALITY, INTERMEDIATE-TERM BONDS
As noted earlier, longer-term interest rates, particularly in the U.S., have increased since the start of the year. Although this has negatively impacted recent bond market performance, it has created another window for long-term investors to lock in higher yields in investment-grade rated, intermediate-term bonds. Furthermore, allocating to high-quality longer-term bonds in a potentially more challenging economic and market environment can provide an effective ballast in a portfolio containing riskier assets like stocks. More challenging economic conditions will eventually precipitate central bank interest rate cuts, likely resulting in bond price appreciation.
SOURCES & ENDNOTES
¹ Notes: U.S. Stock returns are represented by the Russell 3000 Index Total Return USD. International Stock returns are represented by the MSCI All-Country-World Ex-USA Investible Market Index (IMI) Net Return USD. U.S. Bond returns are represented by the Bloomberg Aggregate Bond Index Total Return USD. International Bond returns are represented by the Bloomberg Global Aggregate Ex-USA Dollar-Hedged Index Total Return USD.
² Sources: Bloomberg. Data as of 03/31/2024. Notes: The yield-to-worst for the Bloomberg U.S. Aggregate Index, a benchmark for the taxable U.S. investment grade bond market, was 4.85%. The taxable-equivalent yield-to-worst for the Bloomberg Municipal Index, a benchmark for the tax-exempt U.S. investment grade bond market, was 5.90% based on a 40.8% total federal tax rate (37% plus 3.8% net investment income tax).
³ Sources: Bureau of Economic Analysis. Advance estimate of first quarter 2024 U.S. real gross domestic product (GDP).
⁴ Headline CPI is a measure of the average change in prices paid by consumers for a market basket of consumer goods and services. Core CPI is a measure of the average change in prices paid by consumers for a market basket of consumer goods and services excluding food and energy.
⁵ Sources: National Bureau of Statistics of China. First quarter 2024, China’s real gross domestic product (GDP)
⁶ Eurozone manufacturing is represented by Eurozone Manufacturing PMI Index, and Eurozone Services is represented by Eurozone Non-manufacturing PMI Index. PMI indices are based on surveys of service and manufacturing sector executives. Participants are asked to gauge activity in several areas of their business.
⁷ Sources: Franklin Templeton Capital Market Insights Group, Preqin, World Federation of Exchanges, BIS, HFR, coingecko.com, MSCI. Publication: An Alternative Toolbox for Today’s Market Environment.
⁸ Up to 20% of CRE income paid through Real-Estate Investment Trust (REIT) vehicles can be excluded from Federal income tax. Private real estate distributions can be classified as return of capital distributions and can be tax deferred.
⁹ Sources: JP Morgan, U.S. Bureau of Labor Statistics, U.S. Census Bureau. Publication: JP Morgan 2024 Q1 Guide to Alternatives. Data as of 12/31/2023. Notes: U.S. Retail Sales measures the total sales within the U.S. economy excluding food services.
¹⁰ Sources: TSA. Publication: www.TSA.gov/travel/passenger-volumes. Notes: The average number of passengers passing through TSA checkpoints daily at 2.39 million in Q4 of 2023 compared to 2.31 million in Q4 of 2019.
¹¹ The FTSE Nareit Equity REIT Index is a market-cap-weighted index of U.S. listed equity REITs (excluding telecommunication and timber REITs). The Green Street (All Property) Commercial Property Price Index is a value-weighted index of U.S. private commercial properties that captures the prices at which commercial real estate transactions are currently being negotiated and contracted.
¹² “Public CRE” represented by the FTSE Nareit Equity REIT Index. “Private CRE” represented by the Green Street (All Property) Commercial Property Price Index.
¹³ Sources: GTIS, Federal Reserve, Marcus & Millichap Research Services, Mortgage Bankers Association, Real Capital Analytics. Publication: 5 Significant Challenges Facing CRE Data as of 03-31-2023. Notes: Average % of loans represents average of nonresidential loans, multifamily loans, and construction loans.
¹⁴ Sources: JP Morgan. Publication: https://am.jpmorgan.com/us/en/asset-management/per/insights/market-insights/market-updates/on-the-minds-of-investors/how-will-challenges-in-the-commercial-real-estate-market-impact-regional-banks/
¹⁵ Sources: CRED IQ. Publication: https://cred-iq.com/blog/2023/12/13/2024-commercial-real-estate-maturity-outlook-2023-cre-loan-maturities
¹⁶ Sources: S&P Global. Data as of 03/31/2024. Publication: https://www.spglobal.com/marketintelligence/en/news-insights/latest-news-headlines/nav-monitor-us-reits-close-march-at-15-median-discount-to-net-asset-value-81059565
¹⁷ Sources: Invesco. Data as of 03/31/2024. Publication: https://www.invesco.com/us-rest/contentdetail?contentId=4043d9c7-3fb8-40dd-a6af-9802519addbf&dnsName=us
Past performance does not guarantee future results. Indices are not available for direct investment; therefore, their performance does not reflect the expenses associated with the management of an actual portfolio.
IMPORTANT DISCLOSURE INFORMATION
Please remember that different types of investments involve varying degrees of risk, including the loss of money invested. Past performance may not be indicative of future results. Therefore, it should not be assumed that future performance of any specific investment or investment strategy, including the investments or investment strategies recommended or undertaken by Capstone Financial Advisors, Inc. (“Capstone”) will be profitable. Definitions of any indices listed herein are available upon request. Please contact Capstone if there are any changes in your personal or financial situation or investment objectives for the purpose of reviewing our previous recommendations and services, or if you wish to impose, add, or modify any reasonable restrictions to our investment management services. This article is not a substitute for personalized advice from Capstone and nothing contained in this presentation is intended to constitute legal, tax, accounting, securities, or investment advice, nor an opinion regarding the appropriateness of any investment, nor a solicitation of any type. Investment decisions should always be based on the investor’s specific financial needs, objectives, goals, time horizon, and risk tolerance. This article is current only as of the date on which it was sent. The statements and opinions expressed are, however, subject to change without notice based on market and other conditions and may differ from opinions expressed by other businesses and activities of Capstone. Descriptions of Capstone’s process and strategies are based on general practice, and we may make exceptions in specific cases. A copy of our current written disclosure statement discussing our advisory services and fees is available for your review by contacting us at capstonefinancialadvisors@capstone-advisors.com or (630) 241-0833.